Trying to figure out class C for a 2N3904
I am a bit confused..... I am trying to test something that I saw in a book.
(That is generally how trouble begins)
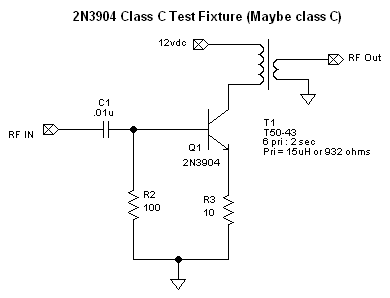
I am trying to test getting a 2N3904 into class c operation. The challenge is that
I can't find an example of the math to calculate how to get to class C. (Most examples
are focused on class A operation.) So I built the circuit on a bread board and
applied power and then some RF from my signal generator.
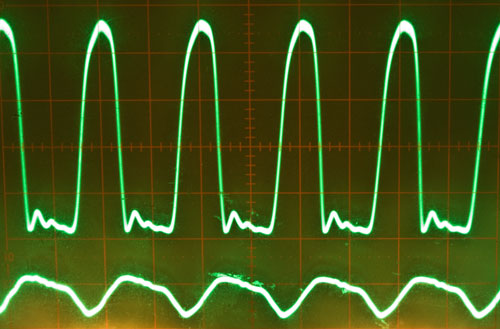
The image from the oscope shows the collector in the upper waveform and the base on
the lower wave form. The divisions are .5v and the probes are set to 10x.
Vcc is 12.5v
Base is about 10v
Collector is about 43v
This is with +20dBm source drive connected to the base.
That is funny... I am banging on that transistor pretty hard. I should look up
the max power for the part. I am probably approaching the fatal value.
--The visual was good for the photo to show the class C waveform.. :-)
My results were.... ummm... poor! It makes a really nice attenuator.

It appears that the transistor is NOT turning on until it gets +10dBm of drive. When
it does turn on it is not very efficient at +2dB of gain. (I was getting 17dB
of gain with 25mA of current in class A a couple of nights ago.)
Positive:
When I added the transformer I did reduce the amount of loading on transistor. It
was nice to be able to see the before and after effects of that on the oscope.
Negative:
It is clear that I need to read some more on this topic as it did not play out the
way that the initial reading might suggest.
Frustration:
I am having a hard time find an example of math model that gives some feel for how
to bias into the various classes beyond class A. (Almost all of the examples are class
A.) When you start moving beyond it into AB & C they start to drop off the math
details and direct you into the push-pull model. (I will eventually get to push-pull..
but I want to understand how it works with one transistor before I try to match up
two of them.)
Next steps:
Try to dig deeper into the bias issue. (It is probably very simple once I understand
this in more detail.)
PS... I updated the post to include an oscope picture of the waveforms.


(That is generally how trouble begins)
I am trying to test getting a 2N3904 into class c operation. The challenge is that
I can't find an example of the math to calculate how to get to class C. (Most examples
are focused on class A operation.) So I built the circuit on a bread board and
applied power and then some RF from my signal generator.
The image from the oscope shows the collector in the upper waveform and the base on
the lower wave form. The divisions are .5v and the probes are set to 10x.
Vcc is 12.5v
Base is about 10v
Collector is about 43v
This is with +20dBm source drive connected to the base.
That is funny... I am banging on that transistor pretty hard. I should look up
the max power for the part. I am probably approaching the fatal value.
--The visual was good for the photo to show the class C waveform.. :-)
My results were.... ummm... poor! It makes a really nice attenuator.
It appears that the transistor is NOT turning on until it gets +10dBm of drive. When
it does turn on it is not very efficient at +2dB of gain. (I was getting 17dB
of gain with 25mA of current in class A a couple of nights ago.)
Positive:
When I added the transformer I did reduce the amount of loading on transistor. It
was nice to be able to see the before and after effects of that on the oscope.
Negative:
It is clear that I need to read some more on this topic as it did not play out the
way that the initial reading might suggest.
Frustration:
I am having a hard time find an example of math model that gives some feel for how
to bias into the various classes beyond class A. (Almost all of the examples are class
A.) When you start moving beyond it into AB & C they start to drop off the math
details and direct you into the push-pull model. (I will eventually get to push-pull..
but I want to understand how it works with one transistor before I try to match up
two of them.)
Next steps:
Try to dig deeper into the bias issue. (It is probably very simple once I understand
this in more detail.)
PS... I updated the post to include an oscope picture of the waveforms.